Graphical Monitoring
The library offers a graphical display of PSU outputs (currently only TTI MX100TP-class and Keithley24X0-class) using Eclipse-Mosquitto, Telegraf, InfluxDB and Grafana, all contained in Docker containers.
Prerequisites
To use the graphical monitoring, Docker and Docker-Compose need to be installed. For installation guides, see:
Setup
Change into the monitoring directory and run docker-compose using the docker-compose.yml configuration file:
cd monitoring
docker-compose -f docker-compose.yml up -d
This will start Docker containers of Eeclipse-Mosquitto, Telegraf, IndluxDB and Grafana. The Grafana docker can be accessed in your browser under: http://localhost:3000.
The data of InfluxDB and Grafana are stored in the docker volumes monitoring_influxdb-data and monitoring_grafana-data. To stop the docker containers simmply run:
docker-compose -f docker-compose.yml down
Once the containers are running, executing <device> monitor -m on the same machine should confirm the connection to the MQTT broker and will send the measurements to the InfluxDB database, from where they can be accessed with Grafana. For example:
$ tti monitor -m ALL
Connected to MQTT broker!
# MONITORING_START 01/01/22
# Time              Voltage1 (V)        Current1 (A)        Voltage2 (V)        Current2 (A)
01/01/22 12:34:56   1.234               0.4567              -9.876              -4.321
This works with the default settings and if everything is run on the same machine. If the Docker containers run on a different machine, or if the measurements should be sent to your own MQTT broker, you can use the options
--brokerto set the host address of the MQTT broker (the IP address where the Docker is running)
--portto set the port where the MQTT broker listens (usually 1883)
--usernameto set the username for broker authentification
--passwordto set the password for broker authentification.
Configuring Grafana
To view the monitored data, you have to setup Grafana. Once the Dockers are running, go to http://localhost:3000 in your browser. Login to Grafana using the default credentials
Username: admin
Password: admin
and set a new password on the next page.
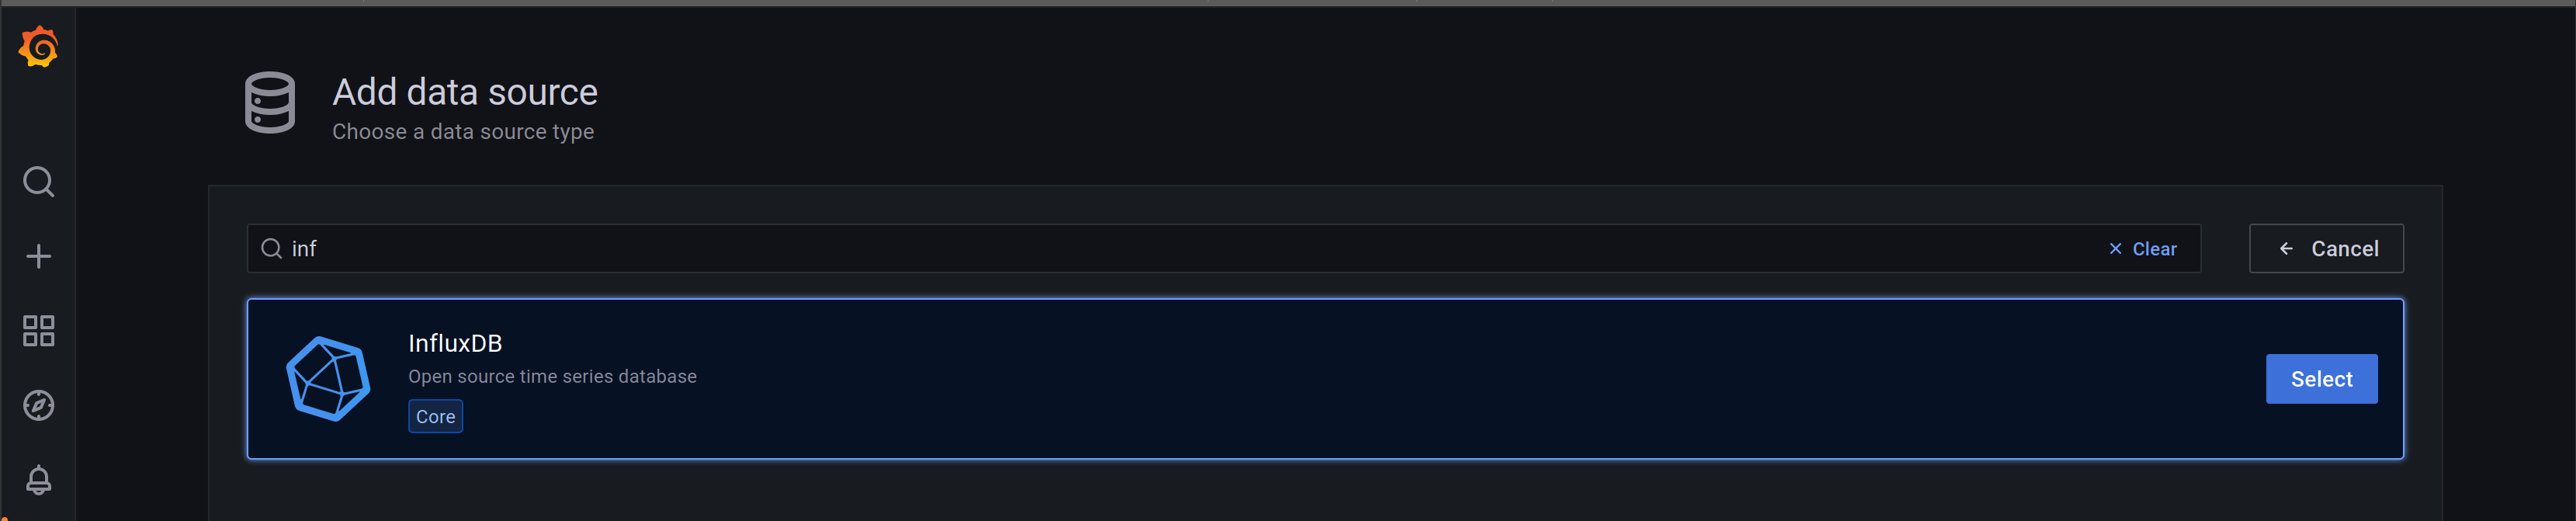
Next you have to add InfluxDB as a data source. Select Add your first data source, and choose InfluxDB.
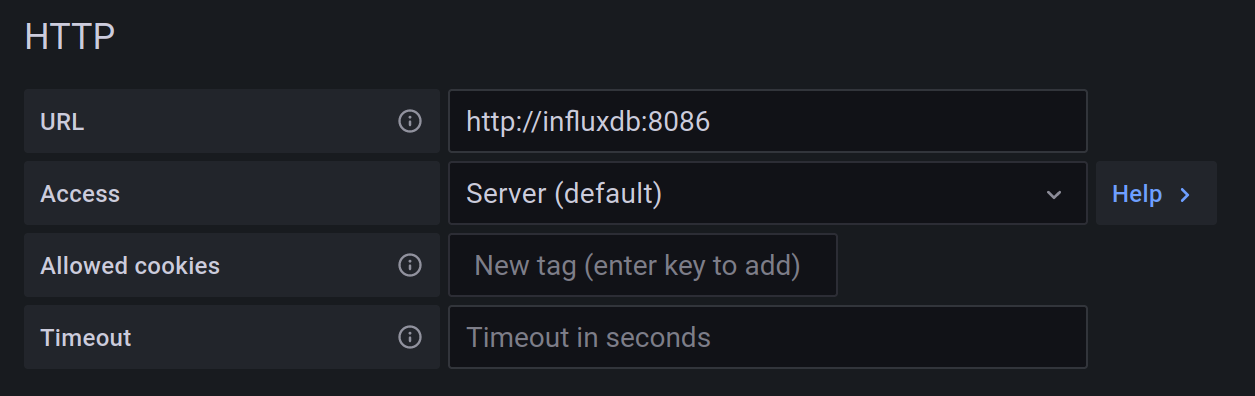
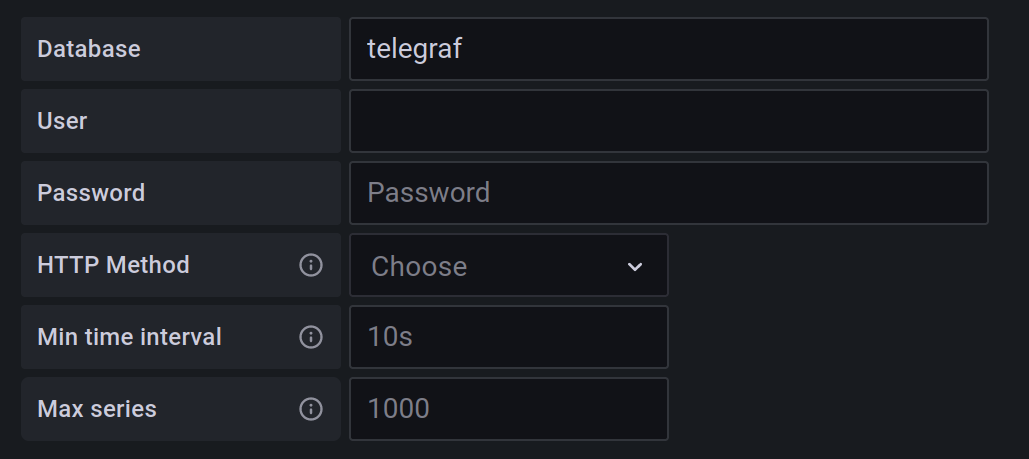
You have to set the URL to http://influxdb:8086, which is the address of InfluxDB in the Docker network, and on the bootom of the page, set Database to telegraf. Click Save & test and Grafana should tell you that the data source is working.
Now you can create a new dashboard and add a new panel with the data you want to display. The data is sent to InfluxDB in the InfluxDB line protocol syntax as follows:
<device name> <quantity>=<value>
The different quantities for the different devices are shown in the table below. The device name is derived from the VISA resource address. An instrument with VISA resource address ASRL/dev/ttyACM0::INSTR will have the device name ttyACM0.
For example, if a TTi low voltage power supply is connected with VISA resource address ASRL/dev/ttyACM0::INSTR and you want to monitor the voltage of output 1 in a simple time series, you need to set the query of the panel to:
SELECT last("voltage1") FROM "ttyACM0" WHERE $timeFilter GROUP BY time($__interval) fill(previous)
PSU class |
Quantity |
Unit |
description |
|---|---|---|---|
TTI MX100TP |
voltage#
(# = 1, 2, 3)
|
V |
voltage on the given channel
e. g. voltage1 for channel 1
|
current#
(# = 1, 2, 3)
|
A |
current on the given channel
e. g. current1 for channel 1
|
|
Keithley24X0 |
voltage |
V |
measured output voltage |
current |
A |
measured output current |
|
resistance |
\(\Omega\) |
measured resistance |
|
PSUTime |
s |
PSU timestamp |
|
statusRegister |
status information of the PSU |